Microsoft has rolled out a new Markers feature for the Azure Maps visual in Power BI, enabling users to replace basic shapes with meaningful icons and dynamic scaling to bring location data to life. The update simplifies map-based storytelling—letting analysts visualize deliveries, assets, or performance metrics without complex GIS tools.
Here’s how it can elevate your map visualizations:
Markers capability
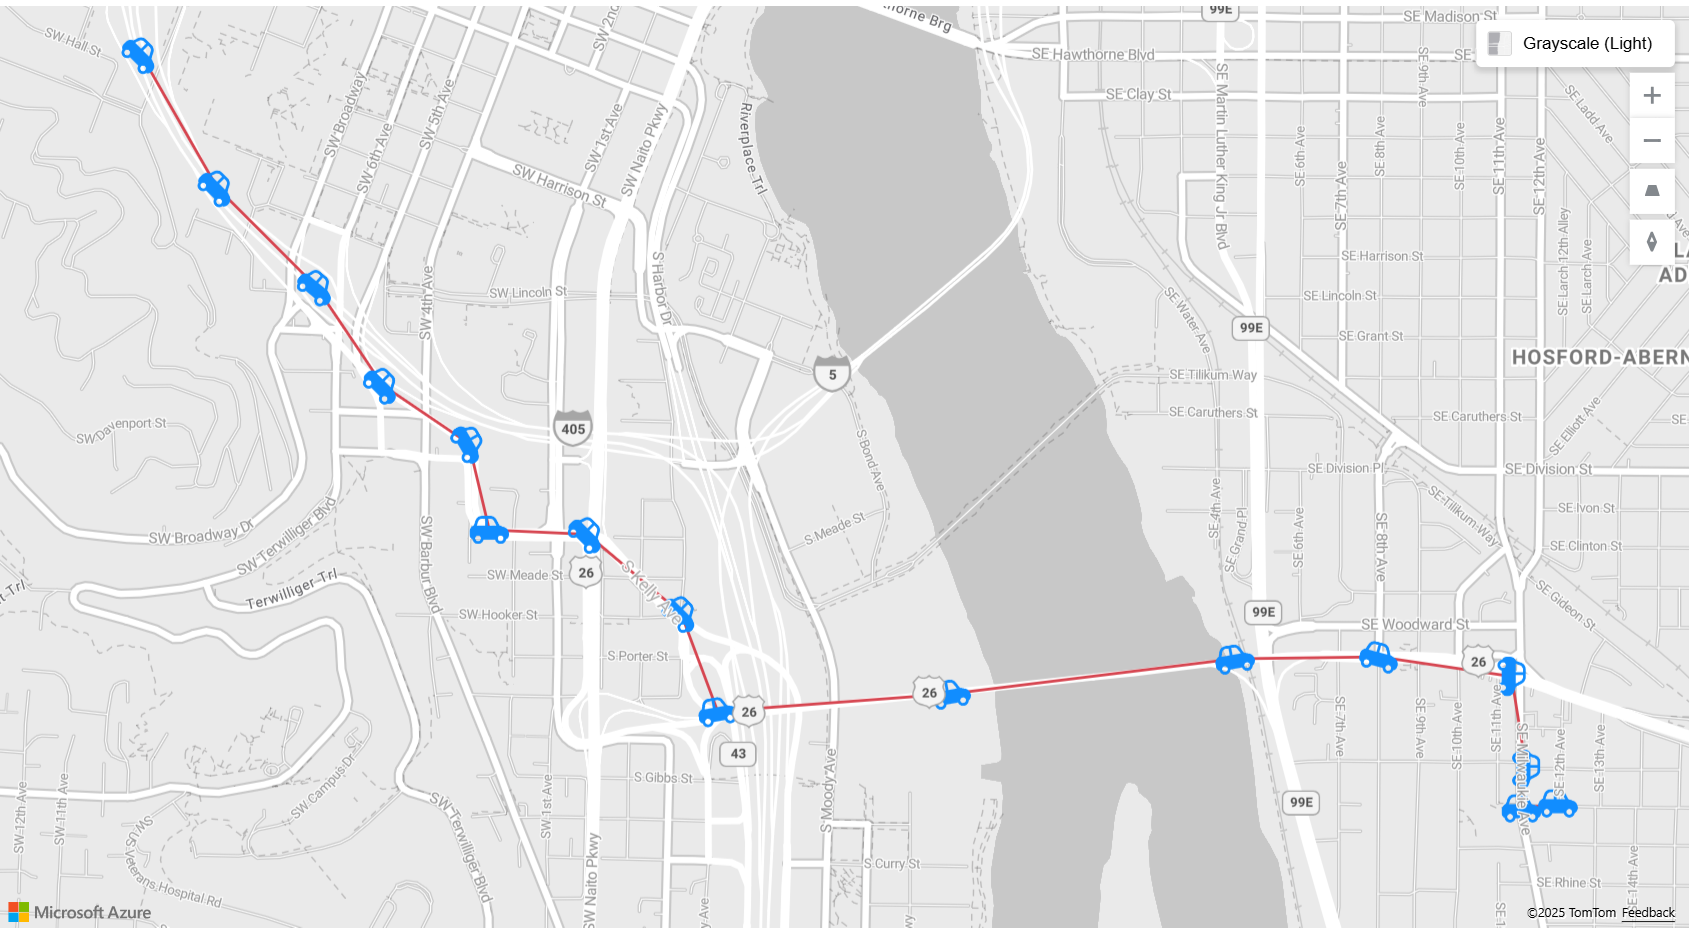
Use meaningful icons or custom images, dynamically scale marker sizes, customize colors and transparency, and assign distinct icons by category—all to make your data instantly understandable.
Real-world use cases
Markers can be used in logistics and supply chain to visualize delivery routes and shipment volumes using truck icons. In utilities and operations, they help represent asset types, operational statuses, or outage locations. Retail and distribution teams can also use distinct icons and colors to differentiate store categories or performance levels.
How to get started
In Power BI Desktop or Web, add the Azure Maps visual to your report and include Latitude, Longitude, and PathID in the Build pane. In the Format pane, go to Markers, select Icon as the marker type, then choose an icon, adjust its size, and use fx on Rotation to bind an angle column for dynamic icon rotation.
Discover how Power BI helped the Independent Police Conduct Authority gain visibility at both macro and micro levels. Read the ICPA case study and get in touch with us today.